Debugger |
Overview |
| Continue execution |
Execute command starting at the
last breakpoint |
| Step in |
Execute commands until next
source line has been reached. If it's a subroutine call abort in first
line within subroutine body |
| Step over |
Execute commands until next source line has been reached. If it's a subroutine execute commands until end of subroutine body has been reached. |
| Step out |
Execute commands until end of current subroutine has been reached. |
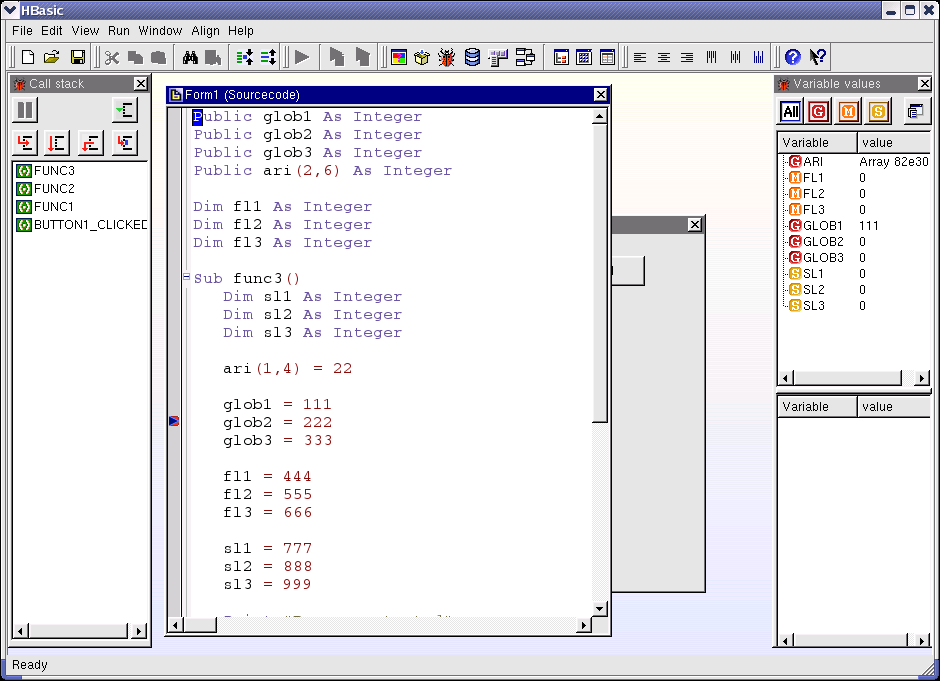
Breakpoints |
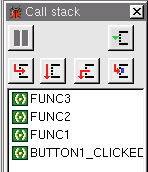
Call stack window |
Display variable values in debugger |
Get detailed variable information |
Display array values |
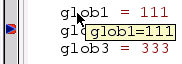
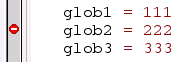
Display values in source code window |